Official Healthcare Pricing Guide™ (HPG)
U.S. Medical Benchmark Prices from Transparency in Coverage and Medicare Data
with the largest and most accurate data
available on negotiated medical prices in the U.S.

Due to its sheer size, the wave of payer data beginning in late 2022 will require significant experience with big data to make its way into useful tools at scale. DDI has that experience.
The first user friendly tool from just released Transparency in Coverage files as mandated by CMS,
revealing negotiated prices from all healthcare payers for all services to all medical providers
Calculated Employer HPG Return On Investment is as much as 1,000 to 1
According to the CAA
For self-insured employers:
As an employer, it’s now your responsibility to ensure your health plan is cost-effective. The Consolidated Appropriations Act (CAA) in 2023 will make self-insured employers the fiduciaries for the healthcare services that they purchase. Fiduciaries may consider how the CAA’s ‘covered service provider’ compensation disclosures could inform generally applicable ERISA principles tied to ensuring those vendors are paid reasonable compensation. This also applies to how health plans or third-party administrators had been bargaining for their employer clients. (HR133)
Request a Health Plan Pricing Report Card™ (custom option)
Be in compliance with the No Surprises Act
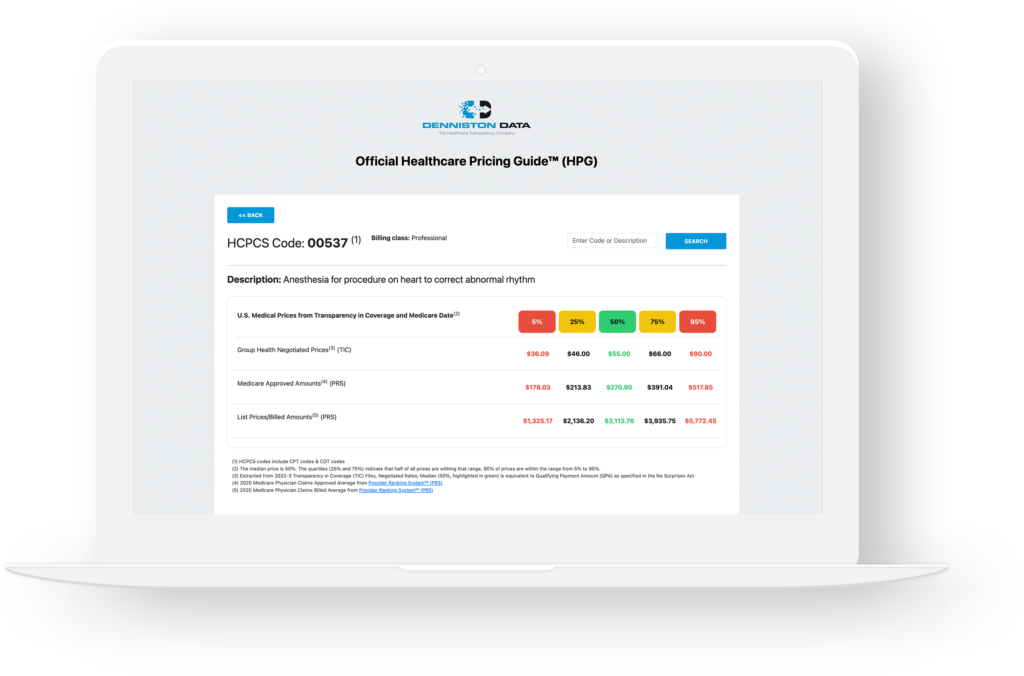
HPG includes the qualifying payment amount (QPA).
The QPA for every medical service is the basis for determining individual cost sharing for items and services covered by the balance-billing protections in the No Surprises Act (NSA), (CMS)
What is a better benchmark, national prices or local prices?
The data shows local negotiated price variations far beyond what the difference would be based on local costs. When it comes to benchmarking files for negotiation with providers, we have found the national benchmarks to be more accurate. If local pricing differences were driven primarily by local costs, a regional cost multiplier could fix that, but they are not. Local pricing differences are much greater than local costs would dictate. They are apparently based primarily on the ability of some local medical providers with market dominance to get away with excessive pricing. Using these prices as a benchmark only reinforces the problem we have now with many excessive medical fees, when using the national tools in the Official Healthcare Pricing Guide™ (HPG) might fix the problem.
Key Benefits & Features Include
-
Save Money, Reduce Healthcare Benefits Costs, by reducing excessive prices paid in your health plan. -
Attract Employees by lessening the need to raise premiums, deductibles & co-pays. -
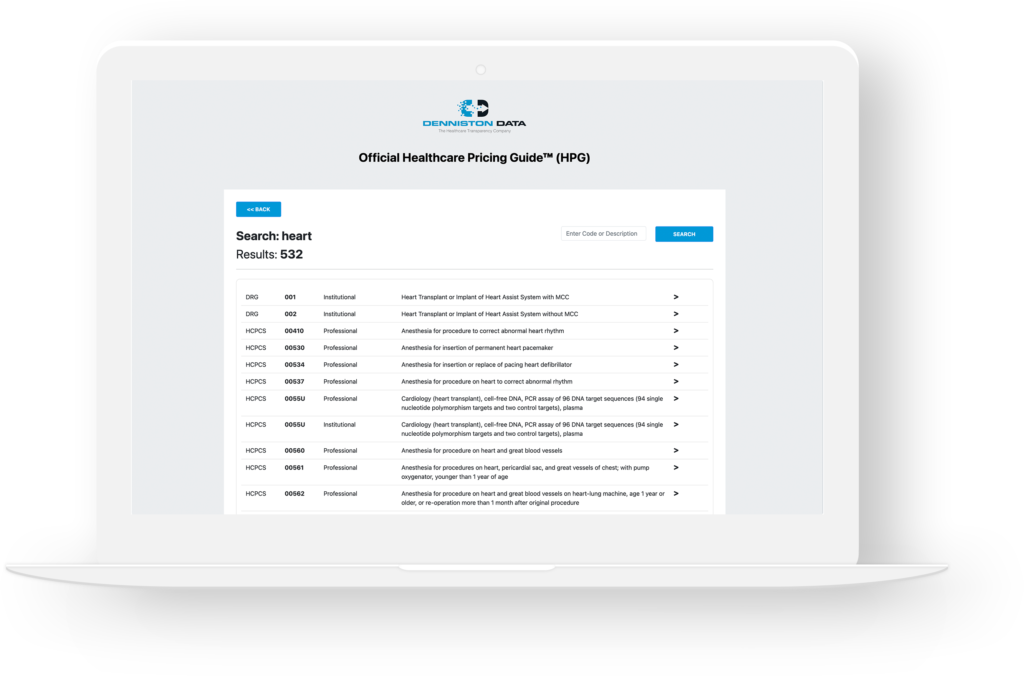
Covers All Reimbursement Codes, DRG (hospitals), HCPCS (doctors & other providers, including CPT & CDT), ICD codes, & RC (revenue codes). -
Based On Billions of U.S. Negotiated Prices, after thorough quality control checking, using over 50,000 health plan non-duplicate files. -
Highest Quality Providers do not cost more. Use Provider Ranking System™ (PRS) to select high performing providers. -
Be in Compliance with CAA (Consolidated Appropriations Act) & NSA (No Surprises Act). -
Highest Quality Providers do not cost more. Use Provider Ranking System™ (PRS) to select high performing providers.
-
Be in Compliance with CAA (Consolidated Appropriations Act) & NSA (No Surprises Act). -
Easily Searchable, using any combination of terms. -
Evidence-Based Data. Objective. Transparent. Real. -
The new standard for Reference Based Pricing (RBP) is the Transparency in Coverage (TiC) Fair Price (Median). -
It is a Fair & Reasonable Price, not depedent on government decisions like Medicare.
More Benefits & Features
- Help Bring Transparency to health benefits.
-
Access What Used to be Highly Confidential, secretive information, now at your fingertips. -
U.S. Healthcare Costs Are Double those in other developed countries, without achieving better outcomes. -
The Target for Fair Price is Median Price, or 50%; the quartiles (25% and 75%) indicate that half of all prices are within that range; 90% of prices are within the range from 5% to 95%; any price outside of that is an outlier. -
Also Shows Physician Claims Medicare Approved Amounts, for comparison, from Provider Ranking System™ (PRS). -
Plus List Prices/Billed Amounts, from Provider Ranking System™ (PRS). -
Further Options Available to retrieve individual negotiated prices by provider and/or by health plan.
- Also Shows Physician Claims Medicare Approved Amounts, for comparison, from Provider Ranking System™ (PRS).
-
Plus List Prices/Billed Amounts, from Provider Ranking System™ (PRS). -
Further Options Available to retrieve individual negotiated prices by provider and/or by health plan.
Unconditional Guarantee: If for any reason you are not satisfied we will refund your payment for the remainder of your term.