Provider Ranking System™ (PRS™) – How Does It Work?
By Phil Denniston, CEO, and Pat Whelan, COO, Denniston Data Inc.
6/23/21
Video Training
For training purposes, click to view our online demo below.
Provider Ranking System (PRS) is designed for use by self-insured employers and health insurance companies to manage networks of providers, and to ensure that their employees or clients have access to the best doctors and other providers. It is also used by case managers and treating doctors to ensure they provide the best medical referrals by researching doctor ranking. In addition, it is utilized by pharmaceutical and medical device companies to identify providers who would be interested in their products.
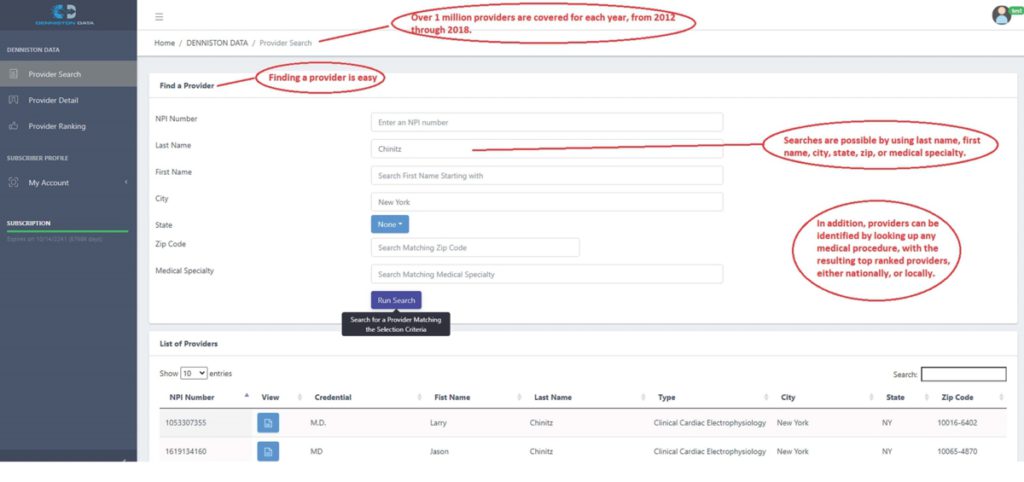
The entry point to PRS is either by provider or by medical procedure. Over one million providers are covered per year, including medical doctors and all other types of providers that bill for medical procedures. You can lookup providers by 10-digit NPI (National Provider Identifier) number, or by any combination of last name, first name, city, state, and medical specialty. Any of these will narrow your search and give you a list of providers, so you can select the appropriate “Provider Page” by NPI.
The other way to start is to begin with a medical procedure. You can access medical procedures either with the appropriate 5-character HCPCS (Healthcare Common Procedure Coding System) medical procedure code, i.e., 93656, or by searching on any words used in the procedure code description, like “arthroplasty,” “ablation,” “hammertoe,” etc. Any keyword will narrow your search and give you a list of procedures and services, enabling you to select the appropriate “Ranking Page,” which identifies the providers performing that procedure in ranked order among their peers.
There are three main content sections:
- Provider Search
- Provider Detail
- Provider Ranking
PROVIDER SEARCH
Click on Provider Search to find a provider. You can search by any combination of NPI Number, Last Name, First Name, City, State, Zip Code, or Medical Specialty. Sample screenshot below:

Provider Detail
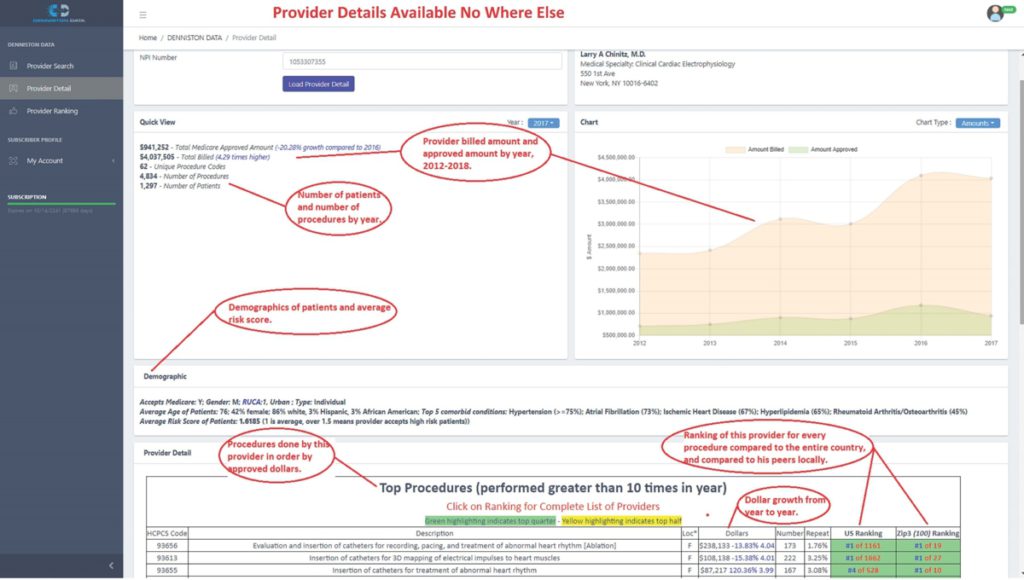
Click on Provider Detail to view provider detail once you find a provider. Once you reach a “Provider Page” that you are searching for, you will see general information on the size of the practice for the latest year, in dollars approved and paid, in dollars billed, in number of patients, in number of different procedures performed, and in total procedures. Data is available from 2012 through the current year, so you can look at every piece of the data for any year. Data trends by year are illustrated through line graphs, which show the direction the practice is going. Is it growing rapidly or declining? Information is also supplied on the demographics of the patients seen by the provider. An average risk score is given, indicating the relative risk of the provider’s patients. The most important information is what the provider does, and how that provider ranks compared to his or her peers, both nationally, and within their own geographic area. To identify which providers ranked higher than this provider, you can click on the ranking, and it will open a new page, the “Ranking Page,” ranking all the providers with respect to how many times they have done this procedure for the specific year being reviewed, as well as compare them to their peers over all seven years by viewing graphical trends. Likewise, the next column provides the same information for the provider’s regional area. The screenshot below shows part of the provider detail for one sample doctor. Within the ranking table it is important to look for green or yellow highlights. When a doctor has a preponderance of greens, both nationally and locally, that indicates a doctor who tends to rank in the top 25%. Yellow indicates the top 50%.

Provider Ranking
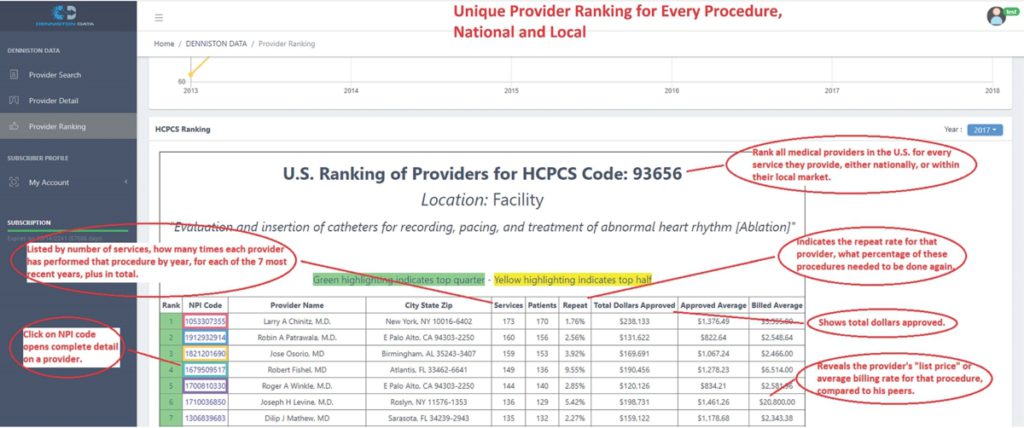
Click on Provider Ranking to view provider ranking by HCPCS (Healthcare Common Procedure Coding System) code. You can access medical procedures either with the appropriate 5-character HCPCS medical procedure code, or by searching on any words used in the procedure code description. Any keyword will narrow your search and give you a list of procedures and services, enabling you to select the appropriate “Ranking Page,” which identifies the providers performing that procedure in ranked order among their peers. The “Ranking Page” is available on a national basis, and on just a local area. Within every ranking page, the “list price,” what each provider bills on average for that procedure, is shown along with the average approved amount in dollars. When you click on any NPI Code in the list, you will open the complete profile on that provider. The screenshot below shows a sample ranking nationally for a specific procedure. The full table ranks thousands of doctors.

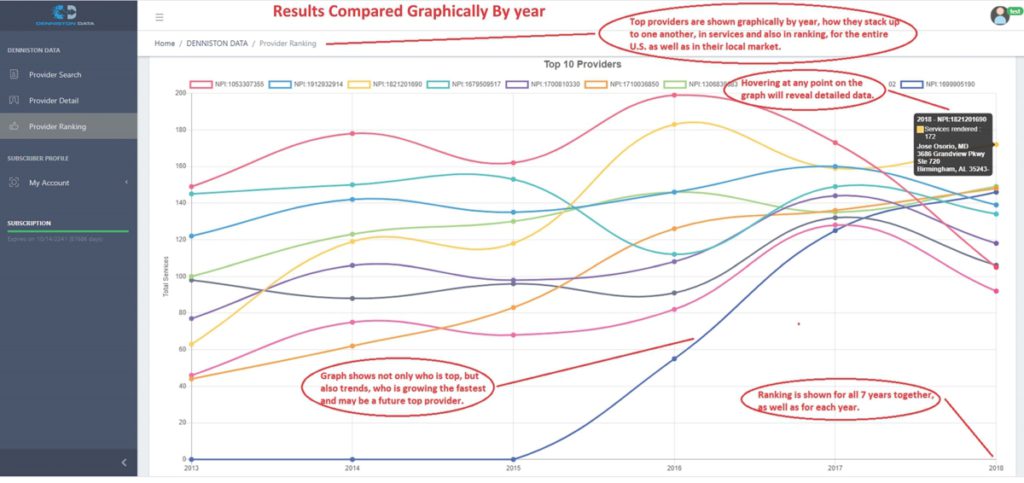
Seven different types of graphs are available, used to identify trends among the different providers. The sample graph below shows the top 10 providers by year for this selected procedure:

